TIGA Projet
BACKGROUND
In 2018, Lyon and Saint-Etienne metropolis, by jointly responding to the State’s call for projects as part of the “Territories of Innovation” programme of the Investment Plan for the Future (PIA 3), have affirmed their desire to carry out joint actions for the economic development of their territory. This candidacy is an illustration that a territorial alliance involving citizens, private sector players and public actors must be able to support and bring about a profound transformation of industry.
Entitled “Industry [re]connected and integrated into its territory and its inhabitants “, this project is built around 18 actions led by the Métropole de Lyon with a threefold objective: (1) to promote the anchoring and transformation of industry by leading it towards sustainable development, (2) to create a framework of trust for exchanges to create value and (3) to facilitate access to and job creation through the development of an industrial culture, the adaptation of skills and the improvement of mobility.
In the TIGA project (Territory of Innovation of Great Ambition), Action 14, Think & do tank, is one of the 7 actions subsidised by the Banque des Territoires. This action meets the 3rd objective of the project presented by the 2 Metropolises of Lyon and Saint-Etienne, whose mission is to “develop industrial culture and adapt skills” to bring a new look at industry, to the acceptability of industry by the citizen and finally to the promotion of industrial professions.
ONE GOAL, ONE METHOD
The objective of Action 14 defined within the framework of the TIGA project is to set up new modes of mediation between citizens and industry in the territory; to produce ideas and concepts whose purpose is to be able to test them quickly in the field. To respond to this, the Science, Society and Industry Think & Do Tank has adopted a methodology based on 4 approaches (Open Observatory, citizen experience, augmented mediation, innovative mediation formats) that enrich each other and combine around a common production process made up of 3 phases: exploratory to identify needs, research to create new modalities and experimentation to test and validate the tools and methods of the R&D phase.
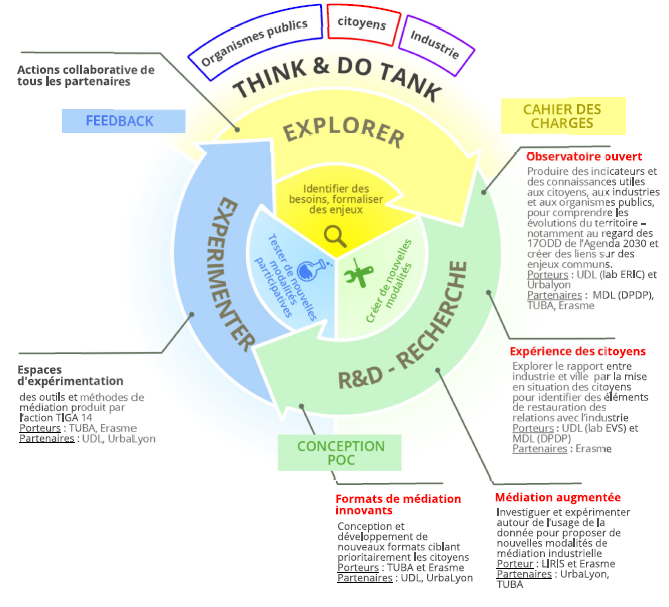
The construction of these tools and methods is the result of continuous research that has made it possible to detect and identify ways of doing things on observation and possible events in the territory;
- By identifying scientific obstacles and proposing innovative solutions (material, digital and methodological supports) from prototyping to experimentation;
- To promote fluid and continuous interactions between the actors of the territory.
Research and developments were carried out in an iterative manner between the project partners and the local stakeholders in order to develop the tools as closely as possible to the needs. It has made it possible to provide a higher level of knowledge on the industrial mediation ecosystem, to develop new working methodologies as well as open, evolving and replicable knowledge bases in other territories, on other themes, with other target audiences.
Action 14 initiates a dynamic that aims to be sustainable, beyond the TIGA Lyon Saint-Etienne project, to become a permanent laboratory for co-creation, research-action and interactions between the actors of the territory. The action research carried out in the Think & Do tank has made it possible to develop new modes of mediation (tools and methods) to promote [ re]connections between industry, the territory and its inhabitants within a 3-year horizon and in 3 previously defined territories (Vallée de la Chimie, Vénissieux, Vallée du Gier) and thus meet the objectives set by the TIGA project frameworks.
ONE ORGANIZATION, PARTNERS
Coordinated by the Université de Lyon and under the scientific responsibility of the Laboratory of Excellence in Urban Worlds Intelligence, the Think & Do Tank has brought together a multidisciplinary and multi-partner consortium for more than 3 years:
The consortium brings together research stakeholders (EVS, LIRIS, ERIC, GREPS laboratories), local authorities (Métropole de Lyon with ERASME and the Department of Foresight and Public Dialogue), TUBA, the Lyon Urban Planning Agency.
The work carried out in a collaborative manner in synergy with the partners of Action 14 as well as with the actors of the TIGA ecosystem has been made visible and accessible to other actors in the territory (mediators, local authorities, associations, companies, citizens) thus making it possible to rework together the image of the industry, to reflect on the integration of industry in the urban space, to train and prepare for the needs of the industry and also to coordinate and structure the industrial mediation at the territorial level.
RESEARCH RESULTS IN ACTION
The multidisciplinary and partnership work carried out during the 3 years of the project shows the potential of research which, alongside its partners, knows how to seize the signals emitted by industrial territories to meet specific needs while proposing innovative solutions thanks to:
- This research supports local experts in understanding and formulating problems.
- Research at the service of the territories that leads to the creation of innovative devices and methods.
The tools and methods developed by Action 14 respond to research issues that have been nourished by exchanges with partners and local stakeholders and allow for continuous improvement and evolution. These issues are based on monitoring and observing the territory’s needs in terms of science and lead to experiments. These results are the illustration of a continuous R&D process; Each tool, each method has been developed in open-source and the associated instructions for use make it possible to envisage their replicability to other territories, for other audiences, on new themes. LIRIS as co-worked on several projects described belows :
Digital twins in the chemistry corridor
Digital twins are tools that are increasingly used in urban planning projects. They are a virtual representation of the physical system and are elaborated from the exchange of information between the physical and the virtual (VanderHorn and Mahadeven, 2021). These urban representations allow us to immerse ourselves in this space and better understand its organization, but also to be a tool of mediation between the territory and the inhabitant. They are mainly built using geospatial data from urban morphology but can be supplemented by other information (public transport network displays, green spaces, industrial areas). The objective of this tool is to provide a better understanding of the space and evolution of cities, but it may lack contextualization on the development of a neighborhood or the history of a building.
Long before urban digital twins, the city was described using documents, images and videos. They provided information on its evolution allowing to compare different periods from a description of the territory. However, it could be complicated to find your way around the space with an archival document or a photo.
Combining multimedia and digital twins makes it possible to bridge the limits that these written and static representations may have. Building a digital city allows buildings or areas to be placed in their context with more information and adds a new way of searching for content through a 3D space. The user could walk around the 3D environment and pick up documents according to their geographical position.
Several questions arise about this new approach:
- How do you integrate multimedia content into a 3D environment?
- How do you represent multimedia in a 3D scene?
In this research context, we collaborated with Interfora, a training centre for chemical professions, and Tuba on the “Behind the fumes” project. This project aims to deconstruct the preconceived ideas that citizens may have had in the territory of the Chemistry Valley (south of Lyon)
In this idea of acculturation of the territory, vox pops and interviews with actors from the Chemistry Valley were carried out to collect and target preconceived ideas upstream. The project first committed to the production of a web-documentary format with a digital representation of the territory integrating in addition archive images of the Feyzin industrial site to trace the evolution of this territory.
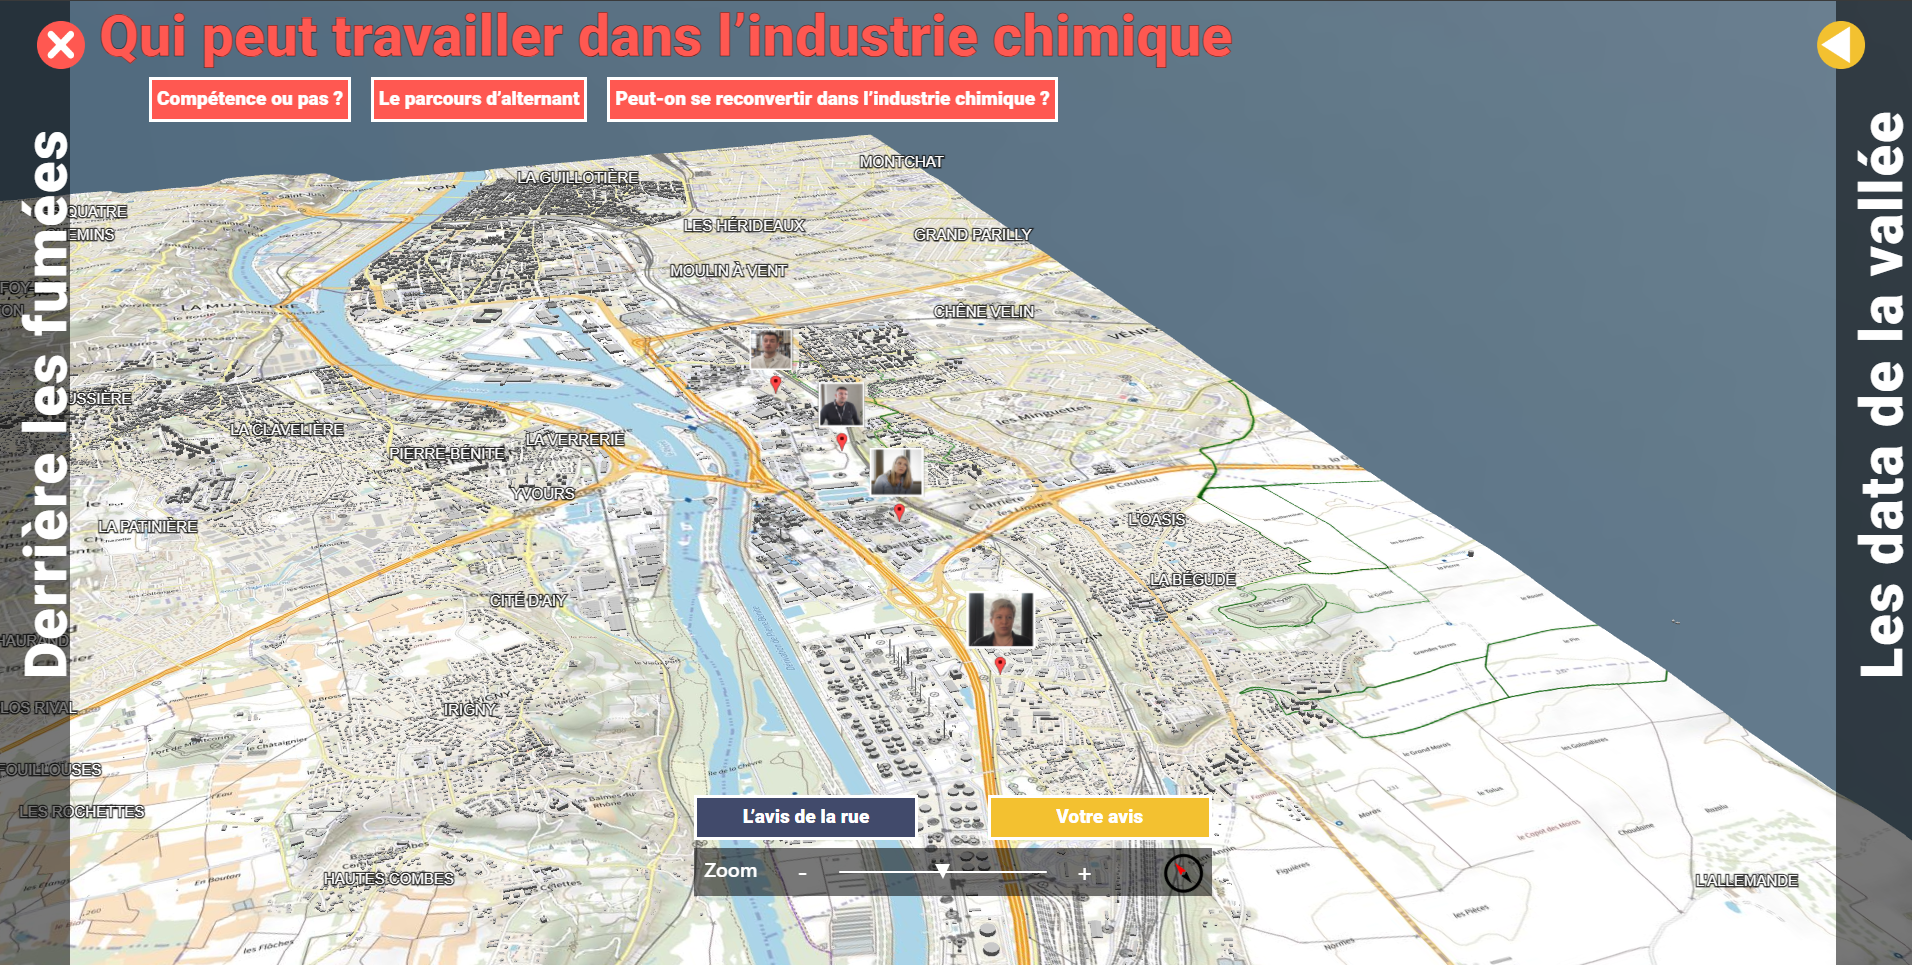
For the integration of the interviews into the 3D space, a miniature is placed on a geo-spatial point and which points to the area concerned by the interview. The thumbnail allows you to preview the content that the user is looking for and when they interact with it, the multimedia is displayed in its entirety and can be viewed. Thus, the thumbnail allows you to contextualize a space in the 3D scene and give more information about what is happening there. The user can both visit the chemical valley digitally and take ownership of the territory while learning about the valley’s production and professions. The web documentary is both a document navigation tool and a mediation device in a territory.
An industrial mediation system in the Gier Valley
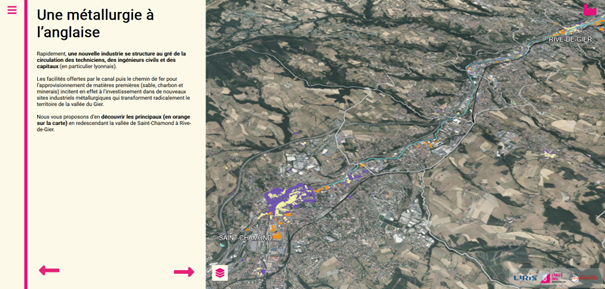
The Gier valley is a unique and complex industrial territory. The future of the inherited and recent areas of economic activity is divided between the heritage enhancement of disused factories through conversion projects (Novaciéries in Saint-Chamond), urban renewal (Duralex wasteland in Rive de Gier) and the affirmation of an industrial vocation. This valley, rich in a network of small metallurgical, mechanical and textile companies, is faced with a problem of attractiveness of its trades, which is combined with a lack of attractiveness of the industrial valley. The objective is to produce an interactive 3D cartographic storytelling tool of the Gier valley that invites, through different guided tours, to discover this territory, its industry and to promote the populations who live and work there. A survey was carried out among employees in the valley in order to find out their profile, their background, their profession and their relationship with the territory.
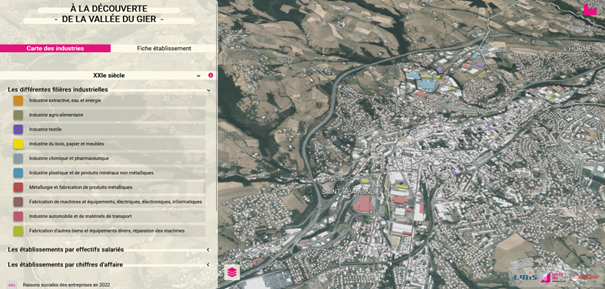
At the same time, workshops have been designed to collect qualitative data from employees. One of these workshops was tested with a blacksmithing company in the valley with the aim of creating a sensitive map of the company. The data collected during the workshop was used to design mini-games to raise awareness of the blacksmithing trades and the organization of the space of a factory. The data collected, cross-referenced with several national and regional databases as well as cadastres from different periods, have made it possible to create a multitude of datasets. These data are divided into 4 periods: the first half of the 19th century, the interwar period (1930s), the 1980s and the 21st century. These data give, for each period, the footprint of the buildings in the valley and the companies (name, sector). For the 21st century, the data also provide (when available) information on the turnover and number of employees of companies.
Using the UD-Viz library (appendix) and the free data of the IGN (buildings, relief, basemaps), it is possible to create a 3D representation of the Gier valley. With this 3D representation and the data collected, we can create a narrative of the territory in a 3D scene. This narration takes the form of guided tours allowing:
- Step-by-step navigation.
- The display of one or more media (text, image, video, etc.) at each step.
- The choice of data layers displayed at each step.
- The ability to apply filters to the data displayed.
The data can also be found in a “free navigation” that allows users to move freely through the 3D representation of the valley, choose which data layers are displayed or hidden and filter this data according to several criteria.
The Pop’Sciences 2023 festival was an opportunity to test the various devices designed during the project with the general public. The measures presented are:
- Mini-games around the blacksmithing industry.
- A LEGO model of a blacksmithing company.
- The digital model of the valley and 4 routes.
Industrial morphogenesis
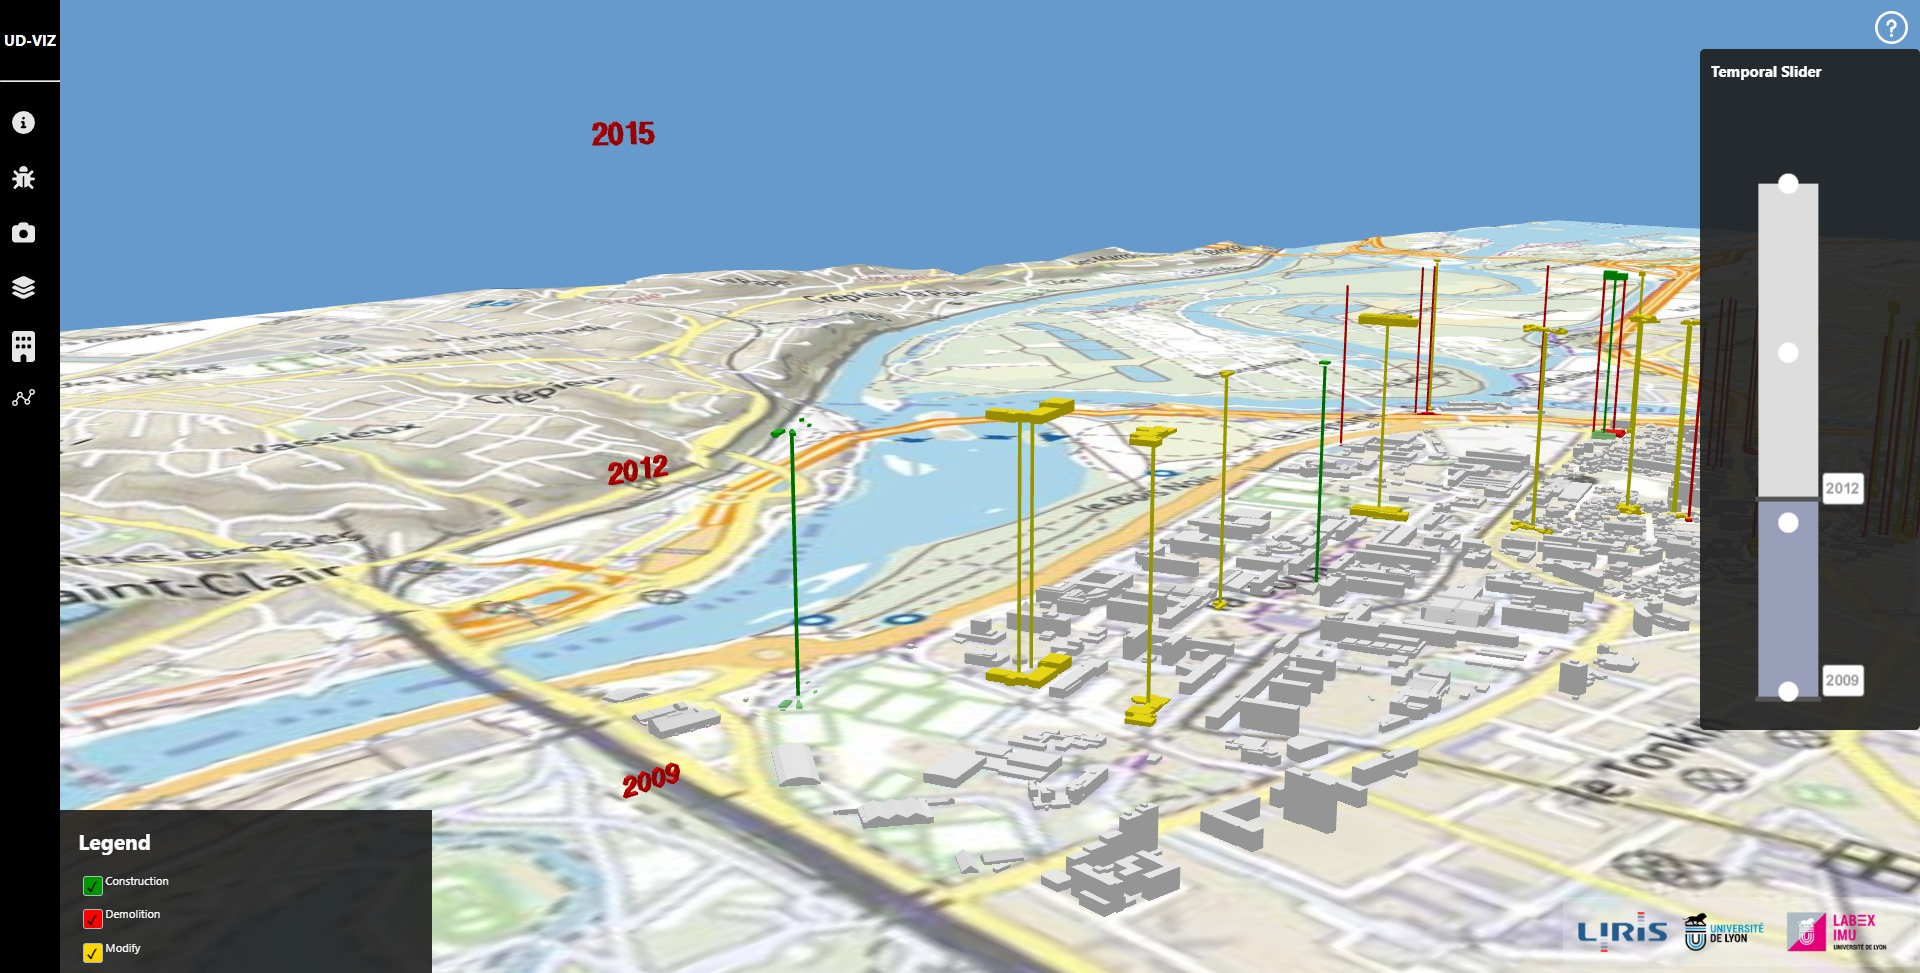
Cities are complex and dynamic entities that are constantly changing. As they grow and face new challenges, their neighborhoods adapt and transform to meet the changing needs of their residents. This evolution of the city can be contextualized using documents, photos, videos or other types of data (see Digital Twins project), which makes it possible to create a version of the city through time. To enable a better understanding of this evolution, 2D temporal urban data can be visualized in a 3D space in order to visualize the data over time. At the same time, 3D representations of cities are increasingly present in mediation tools and allow a better understanding of the organization of a neighborhood, a metropolis, etc.
These 3D representations can also be versioned to preserve the history of a territory. Current proposals for 3D temporal data visualization are generally able to display data at a given point in time, but not its evolution over a period of time. We can think about a new approach to represent the evolution of the territory in a single scene and so the question of how to integrate time into a 3D environment comes up?
In this research context, we focused on the Gratte-Ciel district (Villeurbanne). This territory has evolved a lot and it seemed to us the most suitable for experimenting with our research.
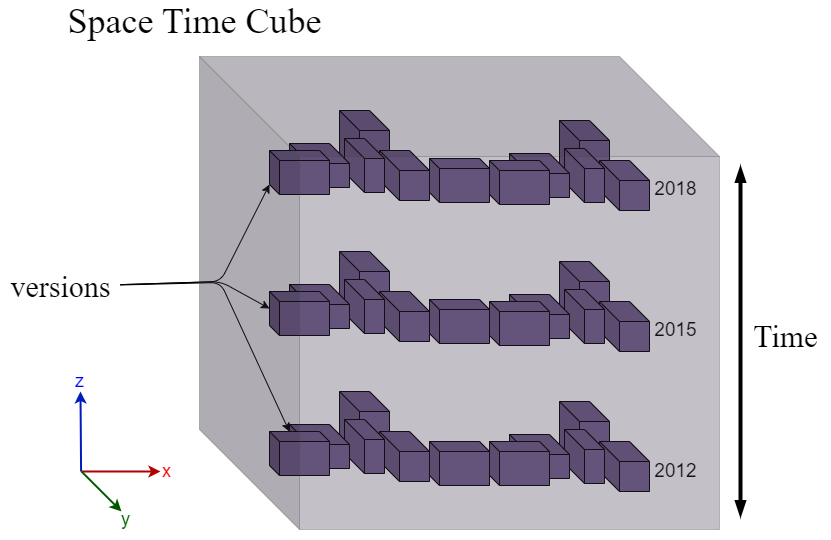
In the world of geomatics, evolutionary data is partly represented using the Space-Time cube. This form of representation allows 2D data to be integrated into a 3D space with time as a vertical axis. STC is more suitable for flow data such as workers’ journeys from their workplace to their place of residence. This allows you to have in the same view, your journey from your place of work to your place of residence with the information of how long you stay in each place and the length of your journeys.
By taking this concept and integrating it with urban 3D data, we can achieve an evolution of the city over time in 3D space. Each version of the city is arranged one on top of the other, from the oldest version to the newest. To complete this visualization and improve the visibility of the evolution, we have highlighted the types of morphological changes of the city versions. We have targeted 3 types of changes: destruction, creation and modification. Mixed with the STC, this makes it possible to quickly visualize which neighborhood may have been modified more than others and to target where there have been urbanization projects.
Additionnal contents
3D Models
The interaction with urban data requires solving a number of problems, such as the massive visualization of 3D objects (buildings, bridges, vegetation, etc.) and the linking of these objects with semantic data (by semantics we mean additional data that enrich the 3D geometric data; these can be attributes or more generally linked documentary corpora). The approach we propose consists of relying as much as possible on standards from L’isso TC/ 211 and the Open Geospatial Consortium. This makes it easier to use existing components, but also to reuse our own components. In this sense, we have chosen, for example, to use the 3D Tiles standard, described by Cesium and the OGC. 3D Tiles has been designed to help the massive visualization of 3D geospatial content. This standard is used to describe a tileset: a 3D tile tree. Each tile contains 3D models with semantic data associated with them. A tileset allows a spatial organization of tiles, optimized for the rendering of urban 3D objects, in particular thanks to the spatial hierarchy of objects, but also thanks to the levels of detail. The levels of detail allow you to alternate between more or less detailed geometries depending on the needs, for example by displaying models that are very simplified from a distance (distance from the point of view) and detailed when you are close.
Tiles can have different formats: · Batched 3D Model (B3DM): Heterogeneous 3D models. · Instanced 3D Model (I3DM): Instances of 3D models. · Point Cloud (PNTS): A massive number of colored dots. · Composite: Mix of different formats.
In the tools developed within the framework of TIGA, we mainly use the B3DM format. This format describes geometries using the glTF format, which is free and facilitates the transfer and rendering of 3D models on the web. Each tile contains a set of 3D models representing buildings or trees, for example. Each 3D model can be associated with a set of semantic information.
The method used to create 3D Tiles can have a direct impact on the visualization of objects. Therefore, it is necessary to have tools to test different tiling methods in order to optimize the rendering and visualization of 3D models. There is also the need to offer the user tools that allow them to create 3D Tiles from different data, adding color, textures, and levels of detail. It is with this objective in mind that Py3DTiles and Py3DTilers were developed.
Py3DTiles
Py3DTiles is a free library for producing 3D Tiles. It offers a set of features to write 3D Tiles from data. Originally developed by Oslandia and Liris, this library has been enriched and robustified during the TIGA project. The first goal of the changes and additions to Py3DTiles is to make it easier to produce 3D Tiles models and customize them. To do this, we have added the extension creation system: the user can extend the standard to add his own features. We have also introduced the creation of materials into the bookstore. These materials allow you to change the appearance of 3D models by applying colors and textures to them. The second objective of the work on Py3DTiles is to ensure that the 3D Tiles produced with this library can be visualized with different tools. To this end, developments have been carried out to verify that the 3D Tiles are faithful to the standard. This makes it possible to be sure that the 3D Tiles created with Py3DIiles can be manipulated by all other tools that also follow the standard.
Py3DTilers
Py3DTilers is an open source tool developed in the framework of the TIGA project. It allows you to create 3D Tiles from different data formats: OBJ, GeoJSON, IFC and CityGML. These data formats are used to represent geographic and urban data, 2D or 3D. The support of these different formats makes it possible to create 3D Tiles from a large amount of data, where each piece of data can be specialized to represent objects in the city in particular. For example, the CityGML standard makes it possible to represent the geometries of buildings and relief. The IFC: Industry foundation classes standard describes the interior of buildings in more detail.
Py3DTilers is based on the Py3DTiles library, described above, to produce 3D Tiles. This tool adds Tilers, allowing each one to transform a precise data format into 3D Tiles. Py3DTilers also includes a large number of options and features to customize the creation, including:
- Creating levels of detail : Allows you to add one or more levels of detail to geometries. This makes it possible to streamline the rendering by displaying more or less detailed 3D models.
- Data reprojection : Allows you to change the projection system used for the coordinates. This makes it possible, for example, to visualize data that originally had different projection systems in the same context. It also allows you to adapt to the constraints that may be imposed by 3D Tiles’ visualization tools.
- Translation and scaling of 3D models: allows you to transform the data by changing the scale or moving the geometries. This allows you to correct errors in the placement or size of objects in the scene. These features also make it possible to place non-geo-referenced data in a geospatial context, or conversely to place geo-referenced data at coordinates centered around (0, 0, 0)
- The OBJ: model export allows you to export the geometries in OBJ format. This format can be viewed in most tools, allowing you to quickly check the appearance of geometries.
- Adding textures : if the input data is textured, the user can choose whether or not to keep the textures. When textures are retained, they are stored in texture atlases as JPEG files.
- Creating Colorful 3D Tiles : Allows you to add colors to 3D Tiles. The colors can be chosen by the user. Colors can be applied according to model attributes (e.g. building height) or according to the type of objects (roof, wall, floor, etc.).
All of Py3DTilers’ options result in a tool with great versatility. In addition, the code architecture allows you to quickly add new features or customize existing ones. Py3DTilers allows the user full control over the process of creating 3D Tiles, whether through options or through code editing. The tool allows you to customize the 3D Tiles produced, to test new ways of distributing tiles or creating levels of detail. Py3DTilers is the ideal tool to innovate or experiment around 3D Tiles, and to propose improvements to the standard. This tool is now available to the TIGA community and allows an easier use of 3D models representing TIGA’s target territories.
In addition to the documentation on the Py3dtilers github repository, a scientific article was written on Py3dTilers and its functionalities as part of an international conference (Smart Data Smart Cities & 3D GeoInfo) which brings together experts in city analysis, GIS, digital twins, smart cities and data science (Py3DTilers article). This paper has been accepted for presentation at the international conference 3DGeoinfo and will be published in the international journal ISPR Annals. The 3D Tiles generated with the Py3DTilers tool can be viewed with different software. Nevertheless, in the majority of cases we use the UD-Viz viewer, a free software that was partly developed during the TIGA project.
UD-Viz
UD-Viz is a JavaScript library that allows you to visualize urban data and interact with it via a Web browser. UD-Viz is based on iTowns, developed by the IGN, with LIRIS being a partner in these developments. iTowns allows you to load and display layers of geographic data as well as 3D Tiles models. As part of the TIGA project, UD-Viz has been enriched to offer the user new interactions with the data as well as better control over the appearance of the 3D models. To this end, developments have been made to enable the integration of multi-media content and 2D data layers. This content makes it possible to enrich the visualization and improve its understanding. In addition, the style management system of the 3D Tiles has been revised to allow greater freedom on the display of colors and textures of the 3D models. This makes it possible, for example, to display colored buildings according to an attribute (height, pollution, density, etc.) or to display colored and textured models alternately in order to offer several visualization modalities.