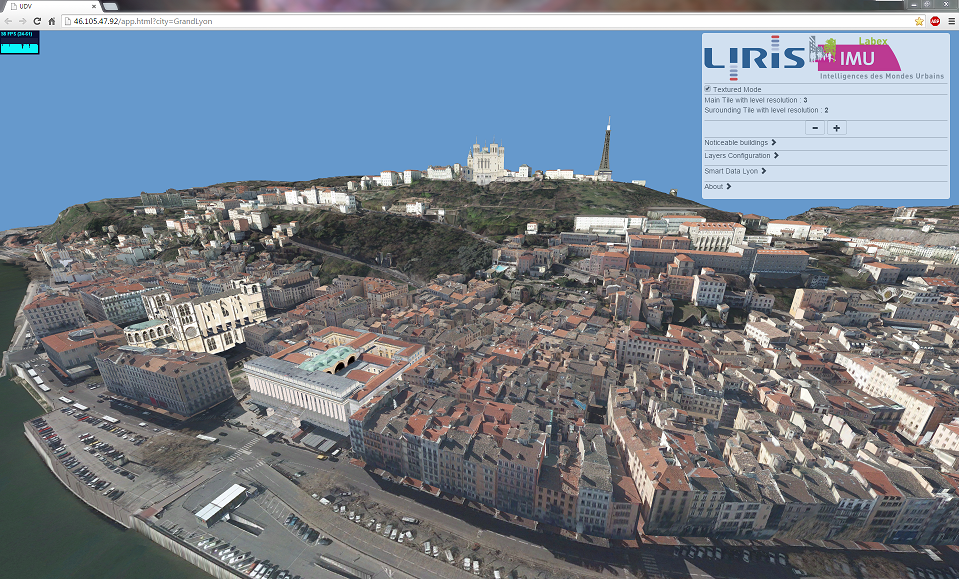
UD-Viz: Urban Data Visualization
UD-Viz develops new processes on virtual models of the city: its ability to simultaneously open multiple file formats allows us to connect models independent but possessing information that may be complementary. With this software (github) , we can access this information and group them together in order to generate results for a better understanding or representation of the city. These results often correspond to textured 3D models representing the studied urban area and containing various informations depending on the needs that motivated the process. However, the results assessment requires a fluid visualization of these 3D models, which can represent a significant urban zone. The memory weight of the data is also too important to allow an immediate sharing of the data, and these are stored in CityGML files that is a standard not yet supported by many consumer software.
In order to address these problems, we have implemented a visualization tool of urban data via web browser: Urban Data Visualization (UD-Viz) . Data is stored on some server after having been prepared with UD-Serv backend tools . This preparation consists in a tiling process of the 3D models according to an adjustable grid and their conversion into JSON format. This data can be separated into several layers and a display strategy can then be set in UDV to allow the user to have the city model corresponding to its needs. In the example of the city of Lyon model, we have a layer for common buildings, one for noticeable buildings, an other for the terrain and a last one for point clouds from LiDAR data. In addition to these files stored on the server, external layers can be imported through WFS data streams from external servers.

Urban Data Visualization has been presented in the international conference “Twentieth International ACM Conference on 3D Web Technologies”.
More on Urban Data Visualization (UD-Viz):