Lyon Métropole partnership
The LIRIS lab
The LIRIS is a joint research unit to CNRS (UMR 5205), INSA Lyon , Université Claude Bernard Lyon 1 , Université Lumière Lyon 2 and Ecole Centrale de Lyon .
LIRIS hosts 330 members and its main scientific domain focuses on computer science and more broadly sciences and technology of information. Many of the Lyon Métropole Open data are empowered within research projects allowing the establishment of new exploitation algoirthms as well as data valorization. More about LIRIS
This page illustrates some of the demos realized by the Vcity project and their relationship with the data they are bound to. It also provides a brief description (refer to the bottom of this page) of the software that was developed in doing so and that made available through a free-software license ( LGPL, GNU Lesser General Public License ).
First demo: exploring Lyon Métropole data vintages
Every three years, Lyon Métropole offers a new vintaged version of its airborne aquired data ( LidAr , CityGML , orthophotos ). This demo uses such vintaged data in order to illusrate the evolution of the city of Lyon accross the 2009 - 2015 period. The underlying methods used for this demo allow both for the analysis of the evolution of cities as well as the planification of future constructions or wider scale urban improvals.
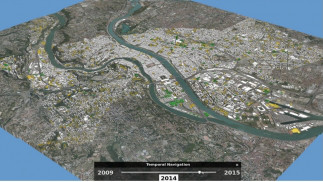
Online demo: 3D visualisation 3D of CityGML based vintaged data
Data used by the demo:
Second demo: assisted understanding and assisted decision making
The ambitious open data project of Lyon Métropole, based on the acquisition of various data modalities that are collected on its territory, its structured organisation and open distribution, allows for new services like their visualization, analysis as well as simulations based on them in order to lower the barrier of their understanding and facilitate assisted decision making. Within a collaborative effort context, this open data strategy allows for multi-modality/cross-fertilization approaches blending derived data together with data obtained through simulation algorithms. Among the various possible uses cases we encounter for example:
-
the place of nature within cities, like
- rooftop usage/occupation
- accessibility of parks
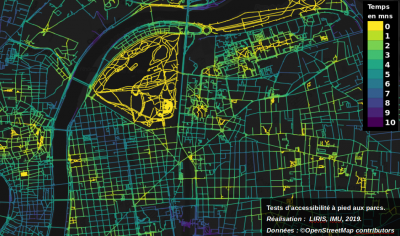
Rendering of (computed) park access walking time
-
Mobility evolution: Confluence neighborhood mobility workshop (joint work with MIT CitySciences )
Online demo: Visualisation of point-based and line based (other) datasets
Data used by the demo :
Software resources (LGPL) developed/used within Vcity project
- Vcity Development
- Web-based urban data vizualiser
- Server side tools
- 3dTiles creation tool (joint effort with Oslandia )
- Geospatial data 3D visualization tool (collaborative effort with IGN )
More: refer to VCity software tools page