Mobility landscapes — an introduction
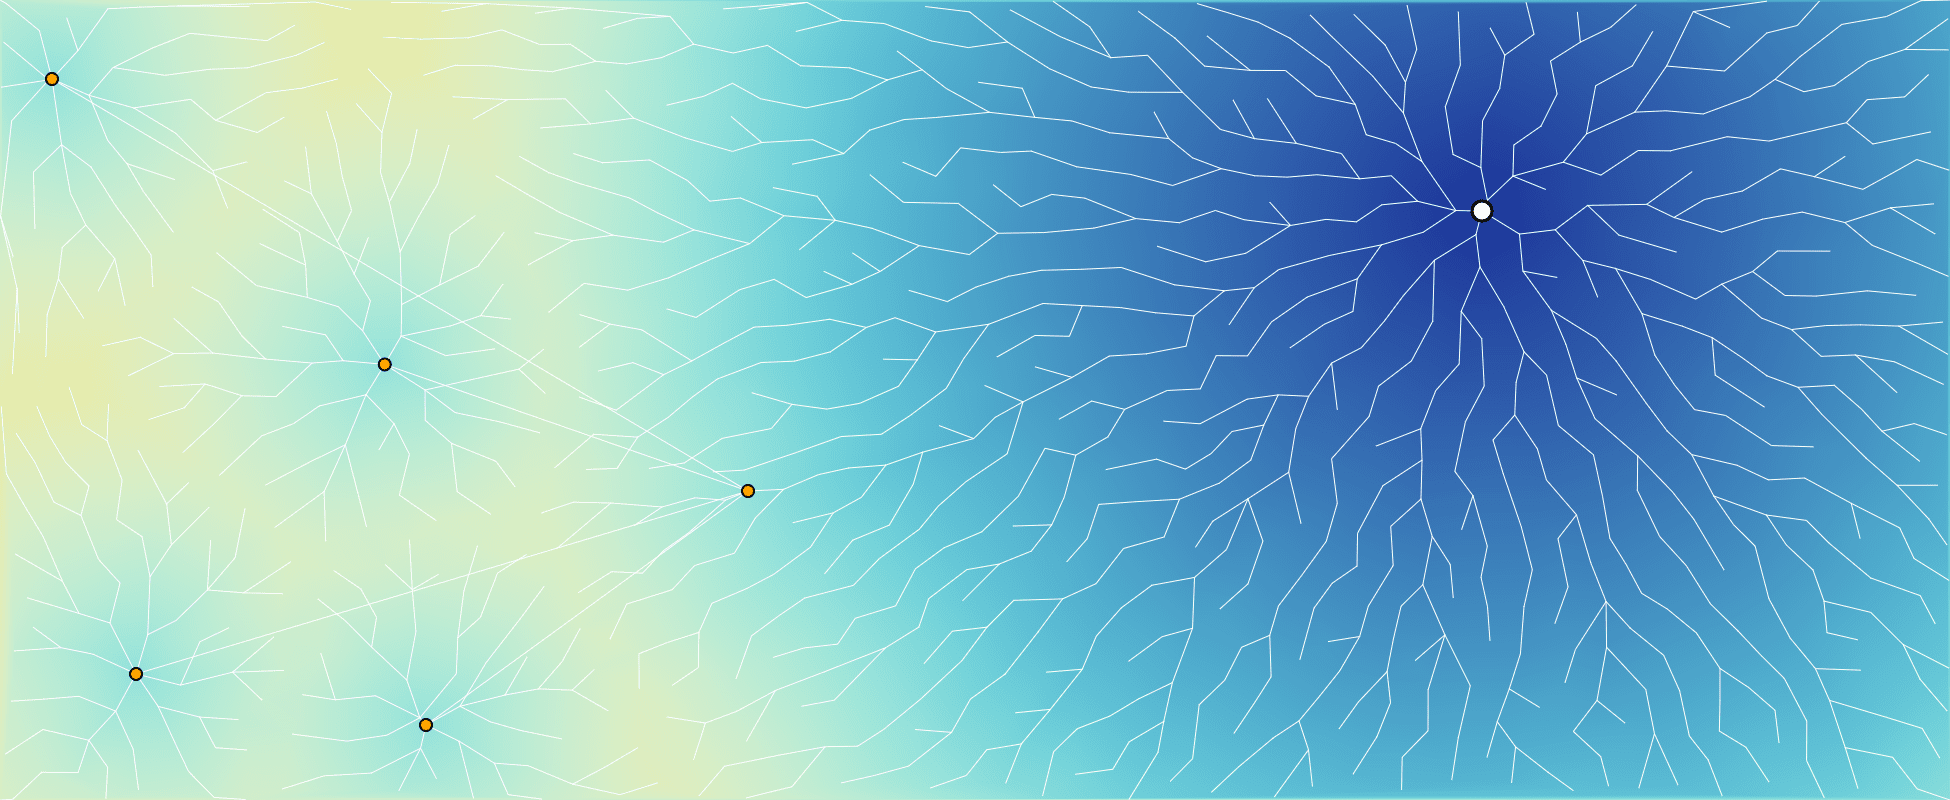
This interactive notebook creates toy models of transportation and introduces a small toolbox that allows to compute the shortest paths on a graph, and draw the results as isochrones.
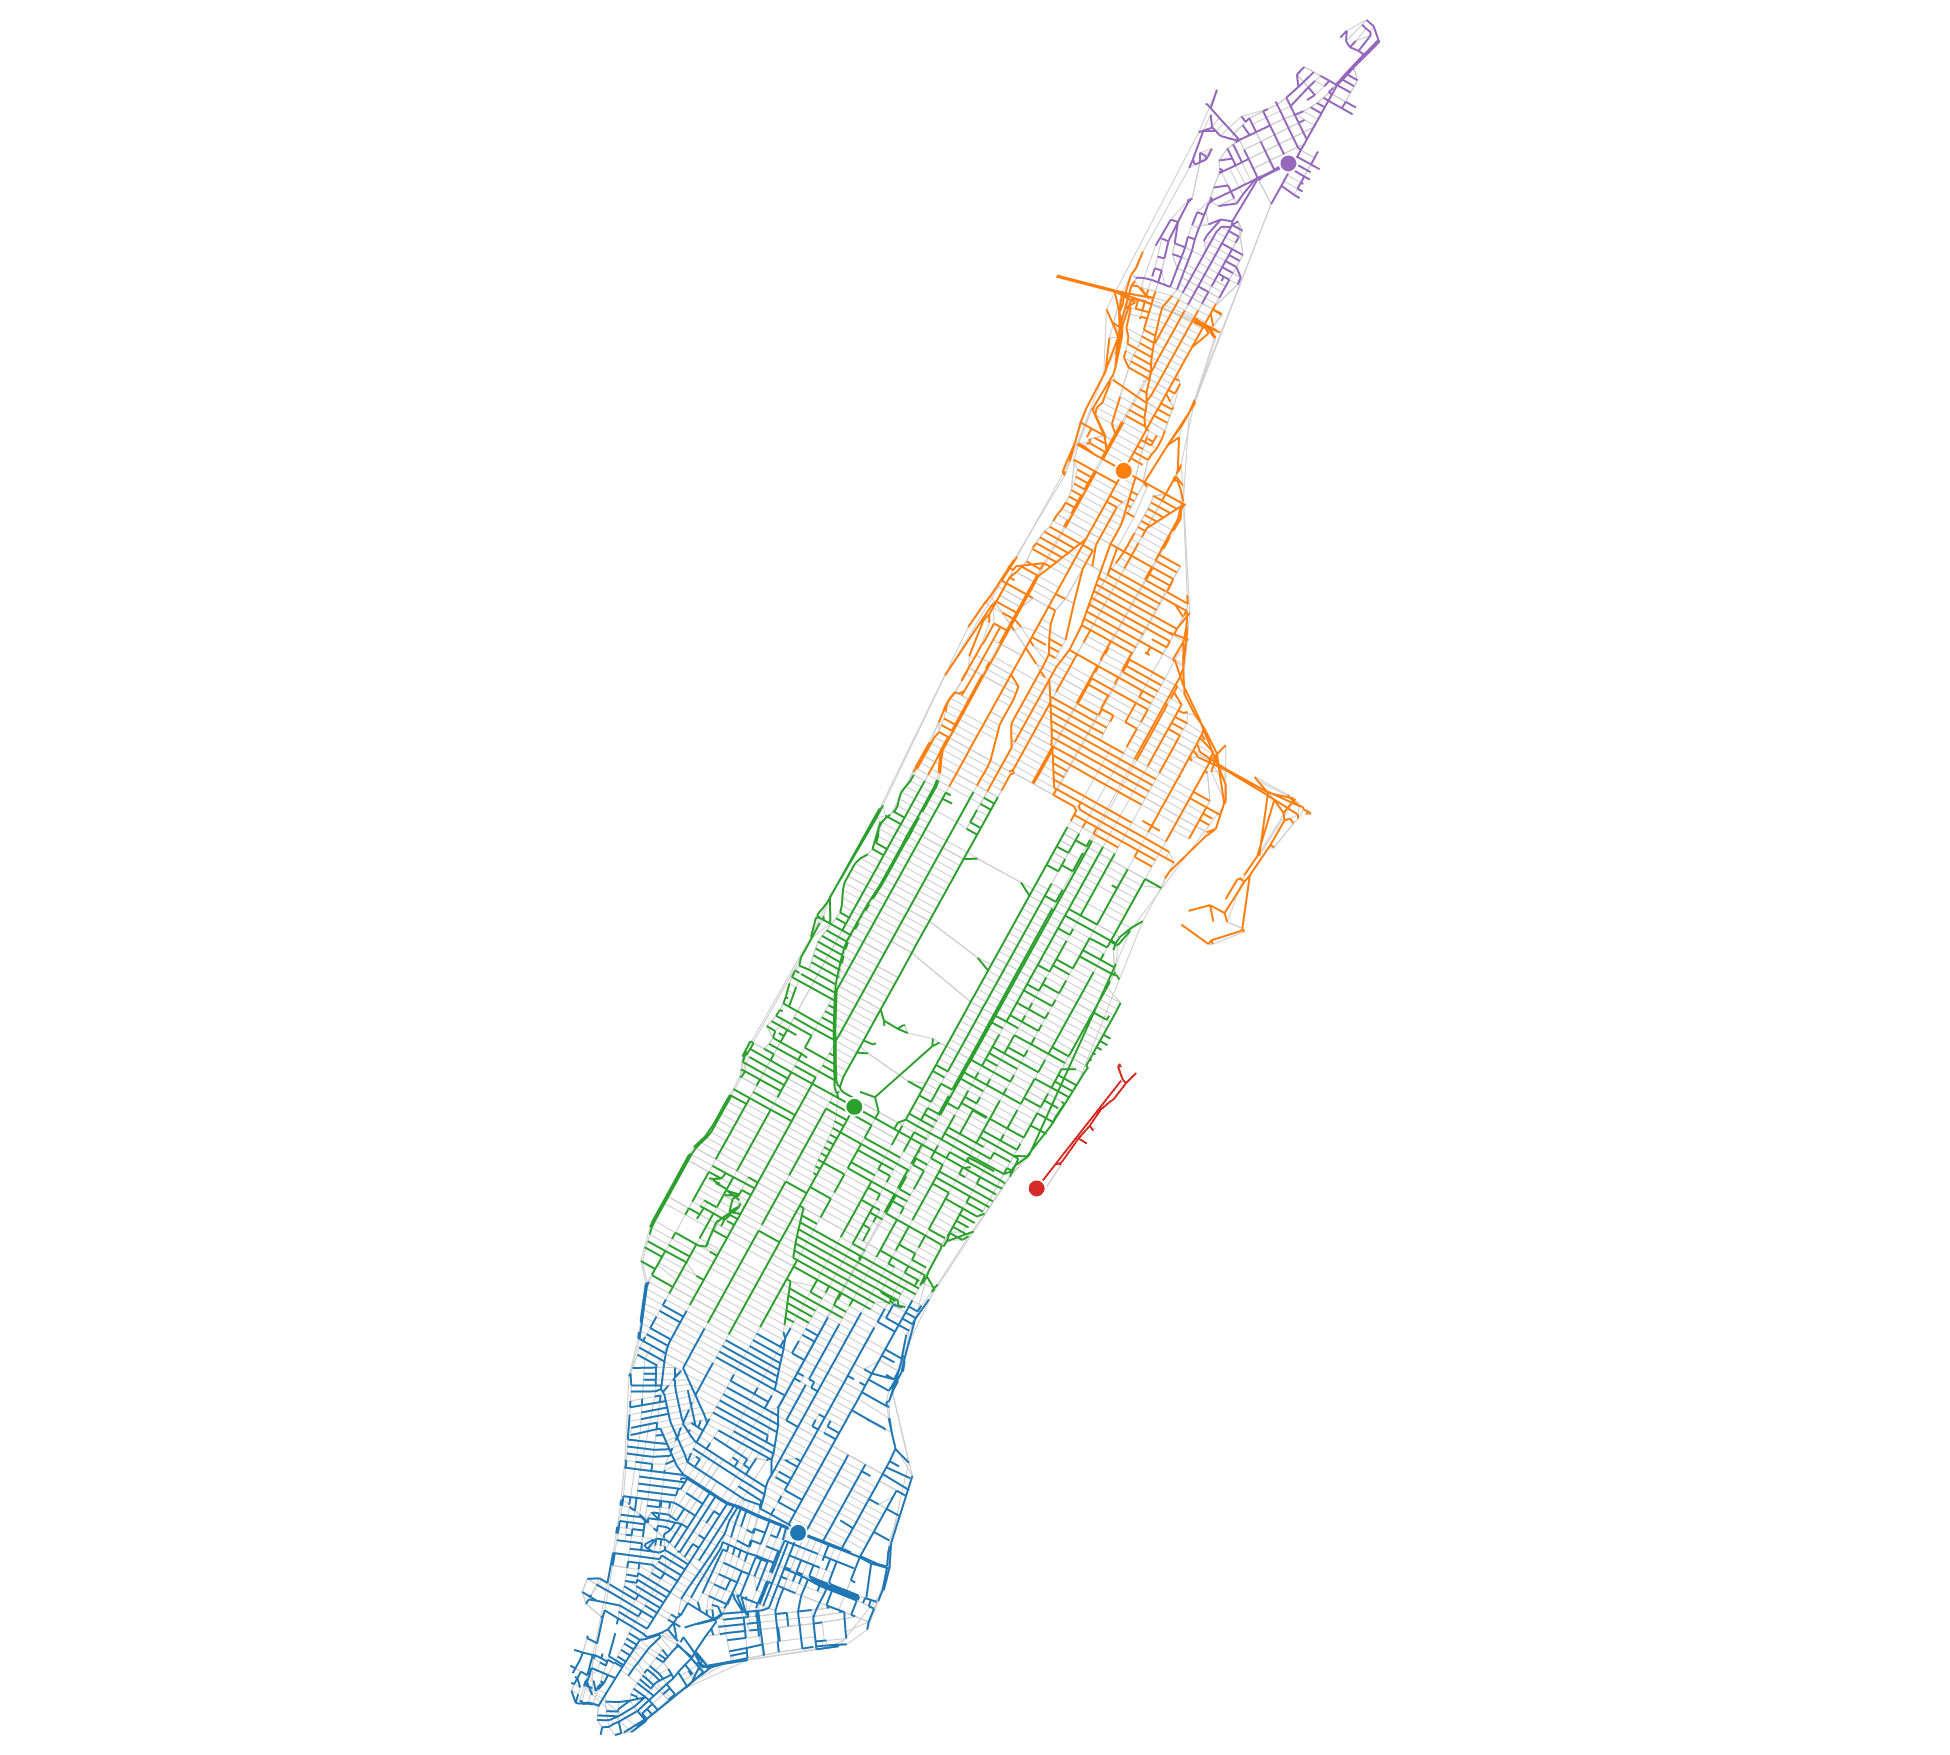
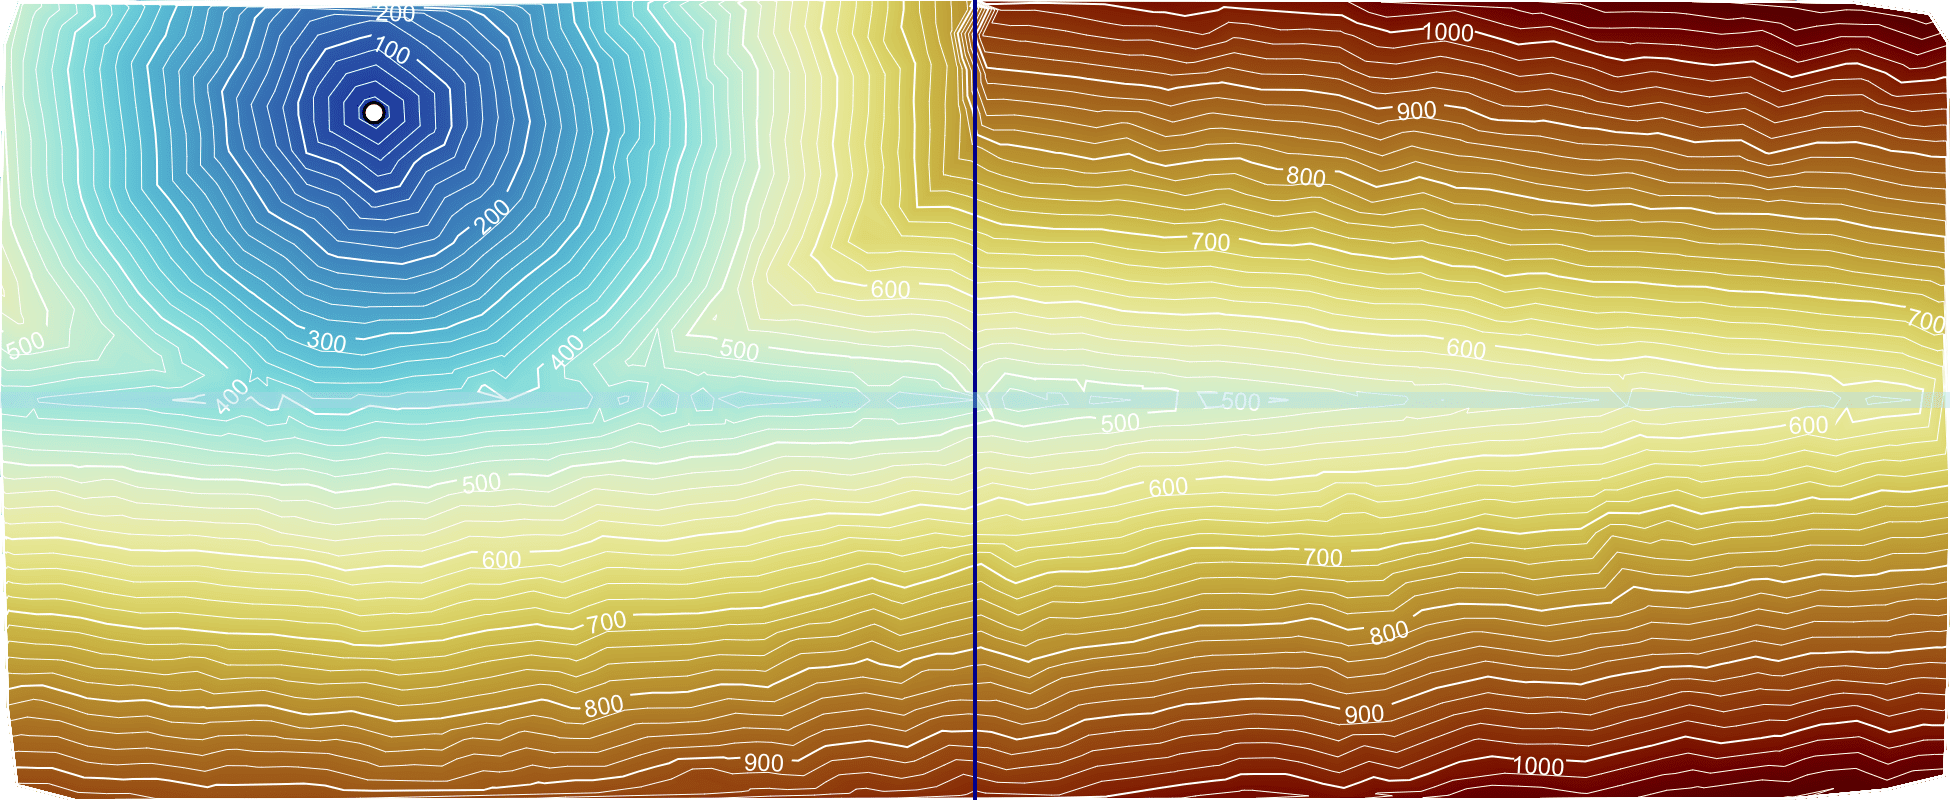
It shows how, from a graph representing a transportation network, we can build a map with topographic level lines representing a cost function.
Below are a few screenshots. You can play with the notebook on Observable.

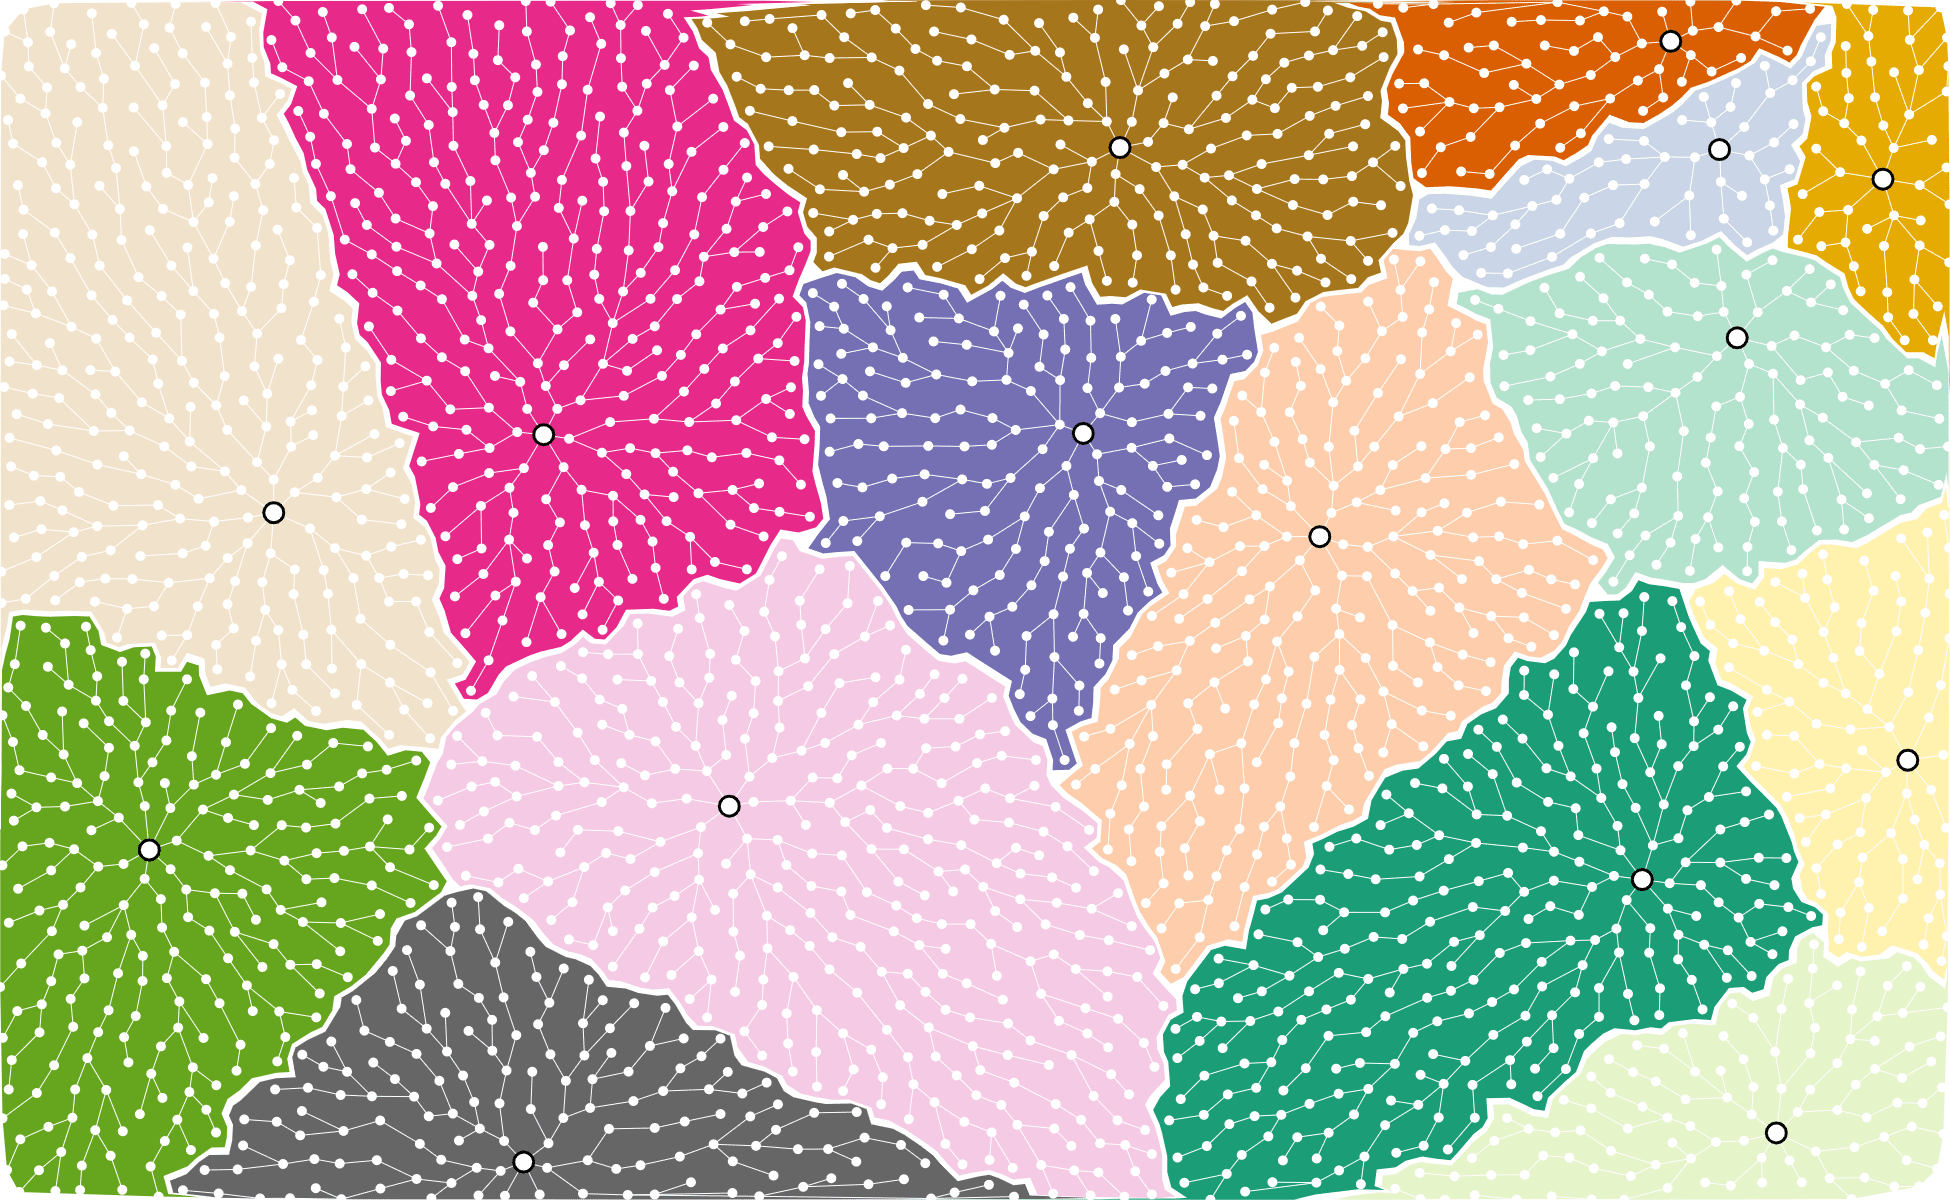
The toolbox that generates these graphs implements a shortest-tree algorithm (Dijkstra) that can be used to create Voronoi diagrams on street networks and other arbitrary graphs: