
You need to cite the following journal paper in all publications including results for which you used the LIRIS dataset:.
C Wolf, J. Mille, E. Lombardi, O. Celiktutan, M. Jiu, E. Dogan, G. Eren, M. Baccouche, E. Dellandrea, C.-E. Bichot, C. Garcia, B. Sankur, Evaluation of video activity localizations integrating quality and quantity measurements, In Computer Vision and Image Understanding (127):14-30, 2014.
Harleval evaluates activity dection, localization and recognition algorithms and computes performances values based on results XML files.
Harleval is available at our download page. It runs under Windows, Mac OS and Linux. It is written in python therefore needs the following things to be installed:
Before you start using Harleval, you should be familiar with the performance metric it employs. It relates how localization and detection quantity is related to traditional precision and recall performance measures. The metric is non trivial, since the goal is not just to classify but also to localize actions in the dataset.
The GUI version of the software is started by running the script
harlgui.pyThe following examples are illustrated with screenshots taken on Mac OS. However, the tools behaves in the same way on Windows and Linux.
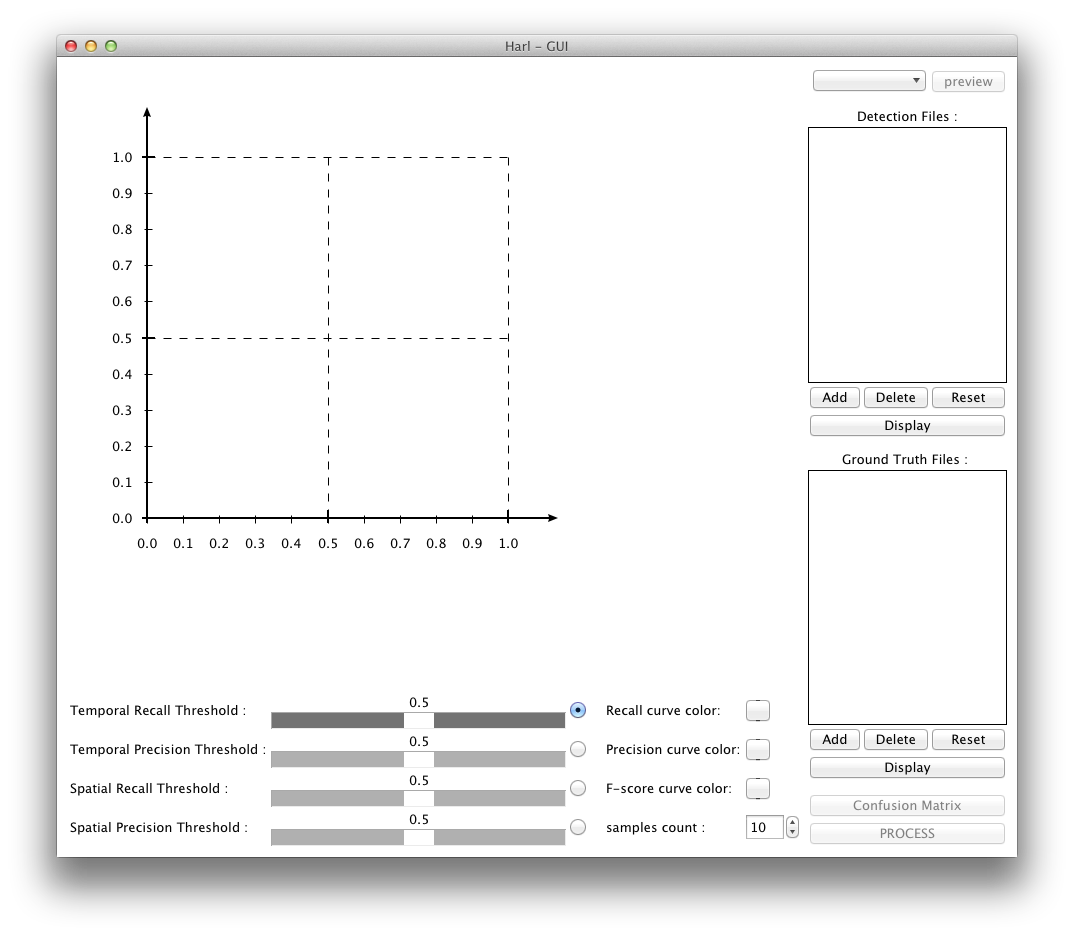
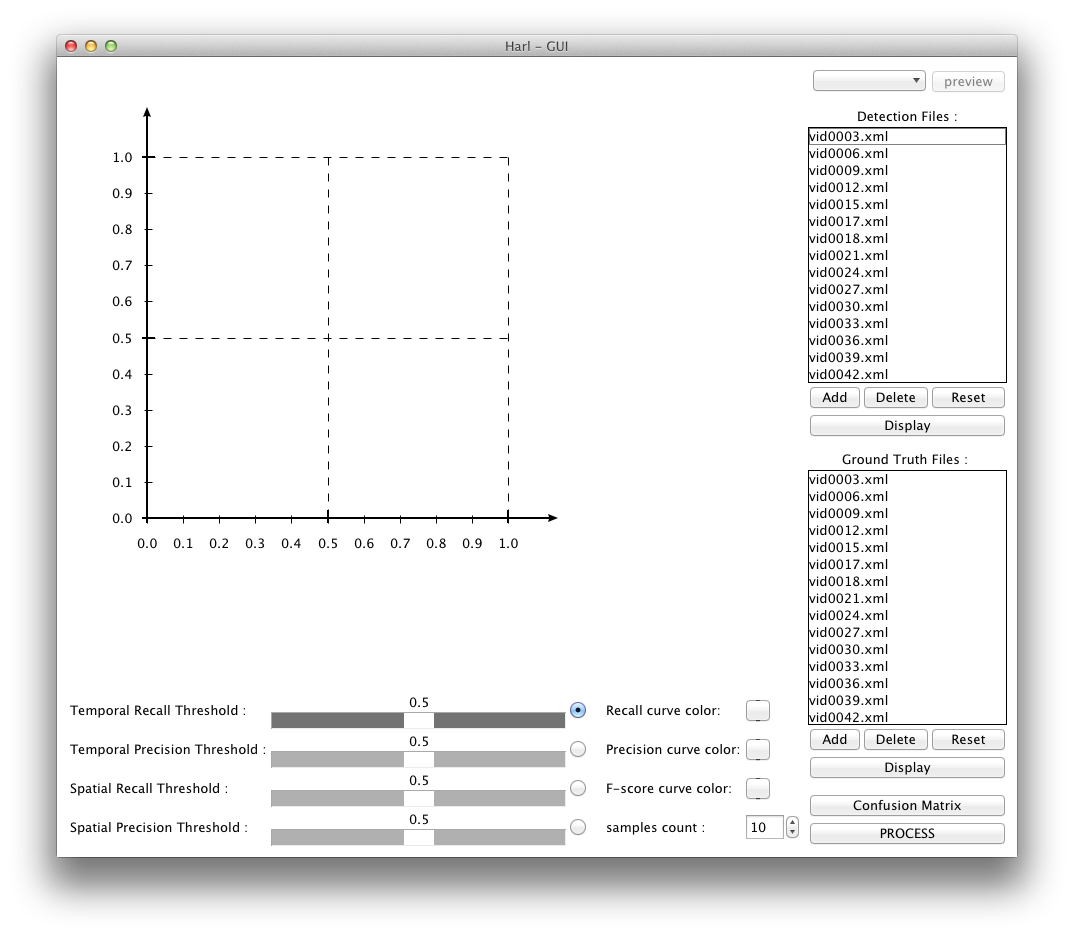
To import xml files in the application use the add button below the section where you want to add files (detection or ground truth). Only .xml files can be loaded. You can remove anyone of them from the list by selecting it and clicking on the “delete” button. The file list can be reset by using the “reset” button. To see the content of any file select it and click on the “display” button below the list.
When loading the ground truth files of the LIRIS dataset, you need to check which subsets you are loading and whether this fits the result files : D1 (Kinect data) or D2 (data shot with the Sony camcorder), and for each one you need to check if you want to evaluate on the training+validation subset or on the test subset.
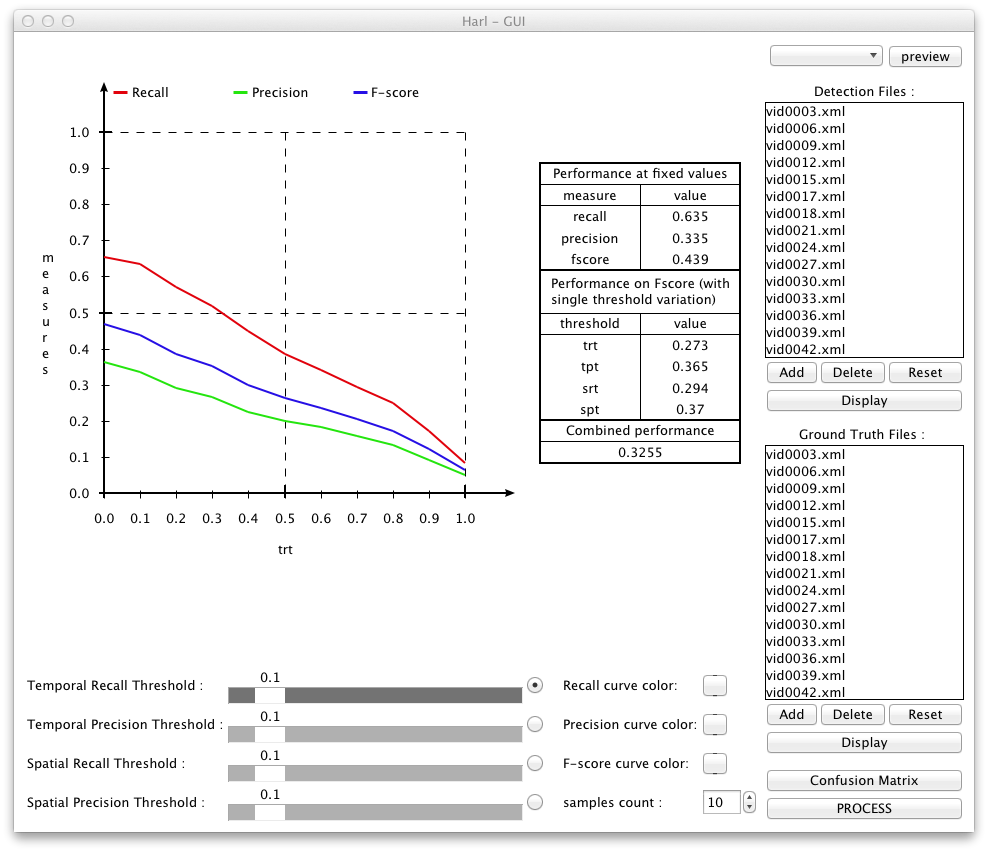
The 4 sliders under the graphic zone determine the fixed values for each one of the four thresholds the performance metric uses (see here for an explanation). If you want to change all 4 parameters to the same value, hold the SHIFT key when you modify one of them.
When all settings seems fine you can press the “Process” button. Processing normally takes a few second, but can be long if you process a high count of files or samples.
The performance curve shows the evolution of precision, recall and F-score (harmonic mean) when one of 4 thresholds is varied and the other 3 ones are kept to a fixed value (see here for an explanation). The varyied threshold is chosen using the radio buttons on the buttom.
The table at the right of the performance curve gives performance values. The first part called "Performance at fixed values" corresponds to recall, precision and F-score for the fixed thresholds chosen with the 4 sliders at the bottom. The next part, called "Performance on F-Score (with single threshold variation)", corresponds to 4 different integrals, each calculated over an f-score curve for a different one of the 4 thresholds. The last part contains the "Combined Performance", the overall value which corresponds to the average of the 4 values calculated in the second part.
Please note that at one given instant only a single diagramm (containing curves) is shown out of 4 possible ones, according to the radio buttons. However, the performance table shows values which are calculated using data from all the 4 diagrams.
Harleval can export results in three different format. To export curves and/or matrix use the "file -- export in .png/.pdf" menu. These options will be disabled if you don't have the following libraries : Image, ImageTk, ImageFile, ImageDraw. It will save a file in the asked format in ./output. The text exportation export numerical values formatted in this way :
##Curves
# trt   tpt   srt   spt   rec   pre   fsc
  0.0   0.0   0.0   0.0   0.142 0.5   0.222
...

##Fixed performance
# trt    tpt    srt    spt    rec    pre    fsc
  0.0    0.0    0.0    0.0    0.143  0.5    0.222

##Integrated performance
# trt    tpt    srt    spt
  0.222  0.02   0.101  0.04

##Combined performance
  0.095
All functionality of the GUI version is also available in a scriptable command line version which is called in the following way :
harl.py <mode> <options>

option list :
--files
--t
--outdir
--fix
In all modes input and ground truth files are needed they are specified by “--files” option. You can put there the path of any .xml files and/or the path of a directory the will be not recursively explored searching for .xml files. To separate input files and ground truth files the symbol “@” is used.
The "mode" option can take one of the four values "basic", "matrix", "perfvalue", and "plot" which each trigger some specific processing and which are described as follows.
This mode calculates basic performance measures like precision, recall and F-score without taking into account any localization information. The bounding boxes in the XML files are completely ignored. For this reason, no localization overlap threshold parameters are needed.
Example:
./harl.py basic --files results/13-valid/*.xml @ groundtruth/*.xml 2> err
The perfvalue mode calculates performance values taking into account localization information. Therefore, the 4 threshold values managing overlap tolerance need to be provided (see here for an explanation). This is done throught the “--t” option followed by a string formatted in this way : each threshold value is separated by the symbol “_” and thresholds are in that order :
Values must be in [0 ; 1] range, can be float, decimal separators “.” and “,” are accepted.
This option can be omitted, which will result as the use of default values : 0.1_0.1_0.1_0.1.
Output: three values separated by white space, in this order: recall, precision, f-score.
Example:
./harl.py perfvalue --t 0.1_0.1_0.1_0.1 --files results/13-valid/*.xml @ groundtruth/*.xml 2> err
In the plot mode, the performance values are integrated over curves which are calculated by varying one of the thresholds while the other 3 thresholds are kept fixed. Additionally to the performance values, the data for the curves are exported which allows to plot them using external software.
In this mode the "--t" option is therefore slightly more complex, as each threshold is not represented by a value but by three : begin, end and step. Thresholds are still separated by “_” and in the same order but the values are replaced by a string containing begin, end and step values separated by “:”. In particular, the format is:
beginTRT:endTRT:stepTRT_beginTPT:endTPT:stepTPT_beginSRT:endSRT:stepSRT_beginSPT:endSPT:stepSPT
This option can be omitted, which will result as the use of default values : 0:1:0.1_0:1:0.1_0:1:0.1_0:1:0.1
The step is also optional : 0:1:0.1_0:1:0.1_0:1:0.1_0:1:0.1 works the same as 0:1_0:1_0:1_0:1
The “--fix” option specifies the fixed value for a threshold when it's not the one varied. The same restriction applies as in “--t” option : values are separated by “_” same order (temporal recall, temporal precision, spatial recall and spatial precision). The values must be in [0 ; 1]
The “--outdir” option specifies the name of the directory where the text files will be saved. It is not a path, the files will be saved in the execution directory.
output:
print fixed-recall, fixed-Precision, fixed-fscore, integrated-1, integrated-2, integrated-3, integrated-4, integrated-total
In this mode, confusion matrices are calculated and exported. Localisation information is used in this mode, as correspondences between bounding boxes need to be established. However, the "--t" option is not enabled. The thresholds are all set to the minimal values "epsilon > 0" (overlap must be greater than zero).
Example:
./harl.py matrix --files results/13-valid/*.xml @ groundtruth/*.xml 2> err
Harleval was written by Tristan Delizy and is maintained by Christian Wolf and Eric Lombardi.
Send questions to christian.wolf (at) liris.cnrs.fr
You need to cite the following journal paper in all publications including results for which you used the LIRIS dataset:.
C Wolf, J. Mille, E. Lombardi, O. Celiktutan, M. Jiu, E. Dogan, G. Eren, M. Baccouche, E. Dellandrea, C.-E. Bichot, C. Garcia, B. Sankur, Evaluation of video activity localizations integrating quality and quantity measurements, In Computer Vision and Image Understanding (127):14-30, 2014.