
70 teams have downloaded our dataset. 4 participants submitted results:
| Nr. | Authors and team affilation | Description | Short team name | Choosen dataset | Loc. provided |
| 49 | Bingbing Ni and Yong Pei Advanced Digital Sciences Center, Singapore Jun Tan, Jian Dong and Shuicheng Yan National University of Singapore, Singapore Pierre Moulin University of Illinois at Urbana-Champaign |
Description | ADSC-NUS-UIUC | D1 | Yes |
| 59 | Dr. Tanushyam Chattopadhyay, Sangheeta Roy and Aniruddha Sinha Innovation Lab, Tata Consultancy Services, Kolkata Prof. Dipti Prasad Mukherjee and Apurbaa Mallik Indian Statistical Institute, Kolkata |
Description | TATA-ISI | D1 | No |
| 13 | Juan C. SanMiguel and Sergio Suja Video Processing and Understanding Lab Universidad Autonoma of Madrid, Spain |
Not available | VPULABUAM | D2 | Yes |
| 51 | Yonghao He , Hao Liu , Wei Sui, Shiming Xiang and Chunhong Pan Institute of Automation, Chinese Academy of Sciences, Beijing |
Description | IACAS | D2 | Yes |
For a detailed description of the evaluation metrics is available here.
The first performance measure ignores the localization information of the results (frame number and bounding boxes) and only provides information on the pure detection and recognition performance through the classical Precision and Recall measures from information retrieval.
Recall is the number of correctly detected and recognized actions with respect to the number of actions in the ground truth. A recall of 100% means that ALL groundtruth actions have been found and correctly recognized.
Precision is the number of correctly detected and recognized actions with respect to the number of detected actions in the result set. A precision of 100% means that no additional actions have been found other than the ones in the ground truth (no false alarms).
The F-Score is defined as the harmonic mean of precision and recall : F=2*P*R/(P+R).
| Nr. | Team | Dataset | Recall | Precision | F-Score |
| 49 | ADSC-NUS-UIUC | D1 | 0.74 | 0.41 | 0.53 |
| 59 | TATA-ISI | D1 | 0.08 | 0.17 | 0.11 |
| 13 | VPULABUAM | D2 | 0.36 | 0.66 | 0.46 |
| 51 | IACAS | D2 | 0.30 | 0.46 | 0.36 |
When localization information is taken into account, determining whether an action is correctly detected requires to set up thresholds on the amount of overlap between the groundtruth action and the detected action. We refer to evaluation metric for more details. In the following table we give precision and recall values for a fixed threshold of 10%, i.e. a groundtruth action is matched to a detected action if
| Nr. | Team | Dataset | Recall | Precision | F-Score |
| 49 | ADSC-NUS-UIUC | D1 | 0.63 | 0.33 | 0.44 |
| 59 | TATA-ISI | D1 | N/A | N/A | N/A |
| 13 | VPULABUAM | D2 | 0.04 | 0.08 | 0.05 |
| 51 | IACAS | D2 | 0.03 | 0.04 | 0.03 |
Here we report integrated performance, as described in our evaluation metric. The four quality thresholds rt, pt, rs, pt are changed and F-score is integrated over the interval of possible values.
| Nr. | Team | Dataset | Rec_T | Pre-T | Rec-S | Pre-S | Total |
| 49 | ADSC-NUS-UIUC | D1 | 0.27 | 0.37 | 0.29 | 0.37 | 0.33 |
| 59 | TATA-ISI | D1 | N/A | N/A | N/A | N/A | N/A |
| 13 | VPULABUAM | D2 | 0.03 | 0.03 | 0.02 | 0.03 | 0.03 |
| 51 | IACAS | D2 | 0.03 | 0.00 | 0.01 | 0.01 | 0.02 |
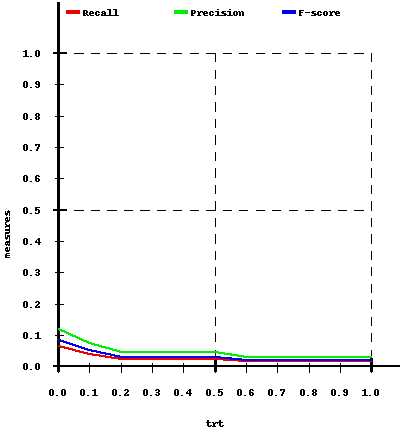
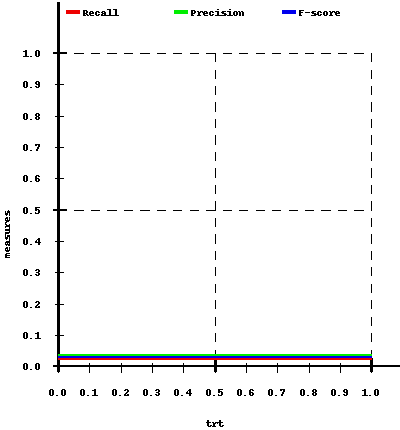
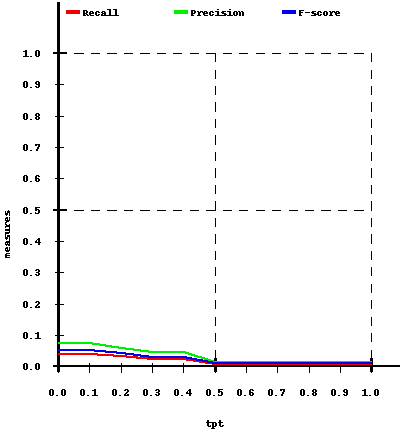
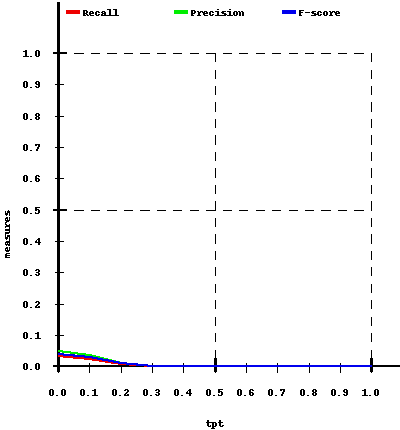
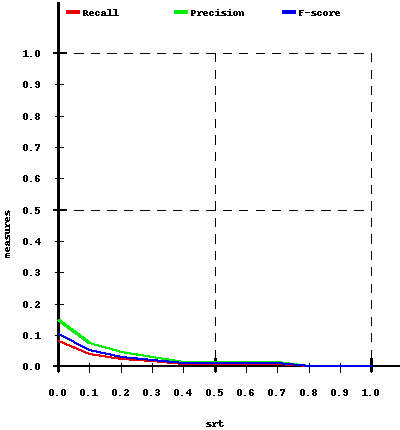
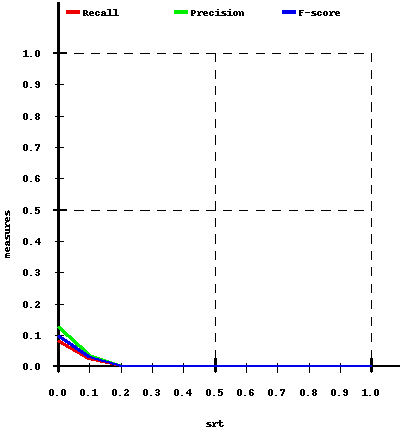
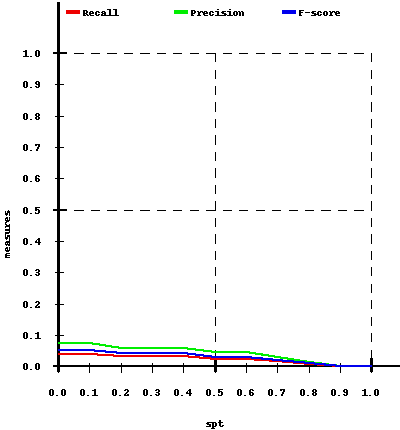
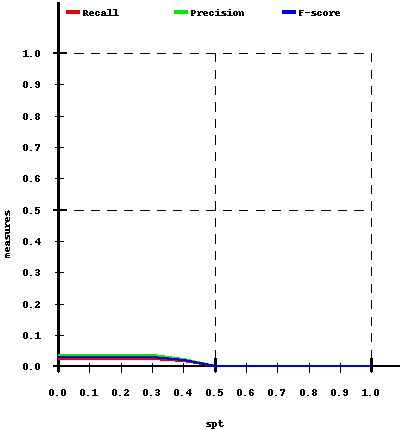
Here we report the performance vs. quality curves described in our evaluation metric. Each diagram presents curves corresponding to precision, recall and F-Score over a varying quality threshold. One of the thresholds rt, pt, rs, pt varies over the x-axis, whereas the other 4 are kept fixed at 10%.
| 49 ADSC-NUS-UIUC | 13 VPULABUAM | 51 IACAS | |
| Varying rt | 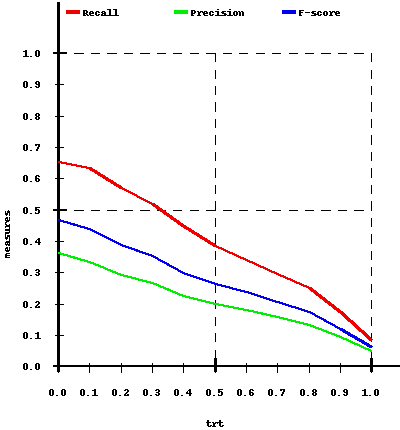 |
 |
 |
| Varying pt | 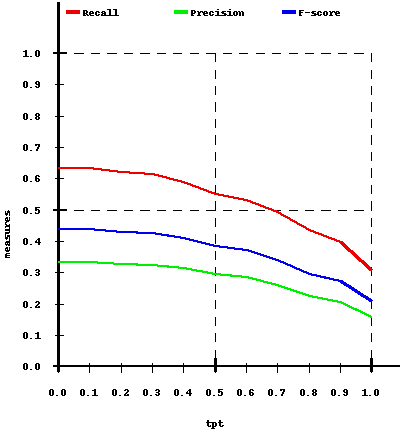 |
 |
 |
| Varying rs | 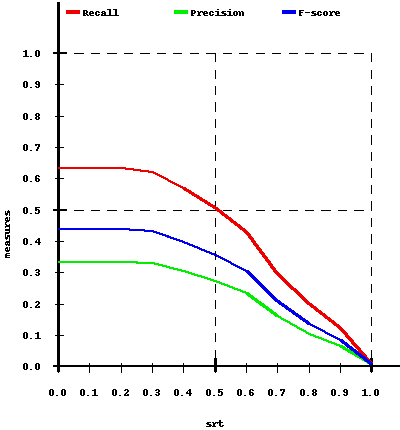 |
 |
 |
| Varying ps | 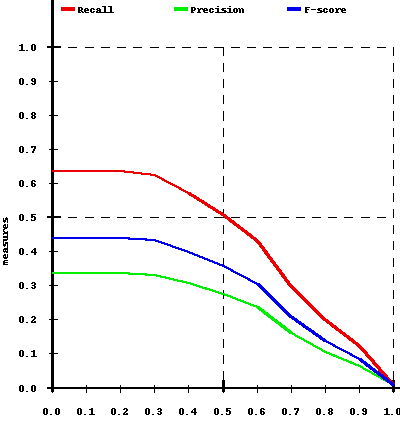 |
 |
 |
The raw data for the plots above can be downloaded here:
| RAW PLOT DATA |
Special care needs to be taken for the interpretation of the following confusion matrices. Only couples of matched ground truth / detection actions are included:
| 49 ADSC-NUS-UIUC | 13 VPULABUAM | 51 IACAS |
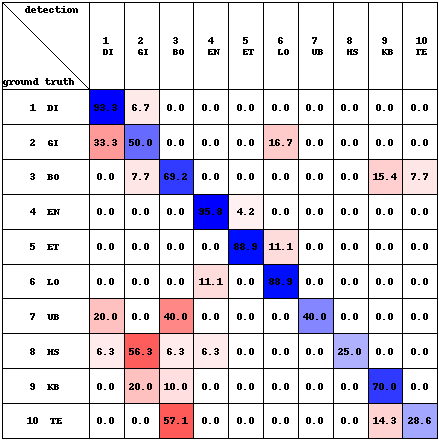 | 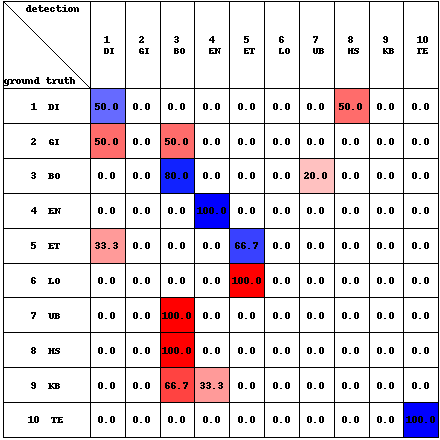 | 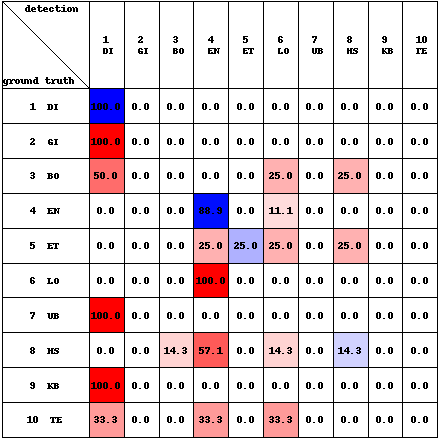 |